|
|
Welcome to this quarterly review where we jump right into the charts, take a longer-term view, and examine the trends in financial markets. |
|
1. Global Diversification Finally Paying Dividends |
For over a decade, large U.S. tech stocks seemed like the only winning bet in town, with diversification beyond the Nasdaq mostly costing investors money. However, Q1 2025 has finally seen this narrative shift as investors rotate into other asset classes. Let's start by examining the U.S. Stocks vs. the World. Since 2008, the MSCI USA has far outpaced the MSCI ACWI, which includes both developed and emerging markets. The past three months have shown international markets gaining ground, but a long-term chart reveals this shift as either a brief anomaly or possibly the start of a broader trend. |
Looking within the U.S. at Stock Market Sectors, since the election in November, Financials, Energy, and Communication Services lead the market, while Real Estate, Technology, and Basic Materials lagged. |

|

|

|
However, Large-cap Stocks continued to outperform small-cap stocks. Professor Aswath Damodaran believes that the much-vaunted small-cap premium may have disappeared due to fundamental structural changes in the global economy. Globalization has forced small businesses to compete against international firms with dramatically different cost structures, while larger companies have adapted by moving production to cheaper locations. Additionally, the rise of momentum trading has strengthened large-cap performance, as investors chase winning stocks that continue to win. The explosion of passive investing through index funds and ETFs has further concentrated money in large-cap stocks, as these vehicles typically allocate capital based on market capitalization. Finally, technology-driven industry consolidation has created winner-take-all markets where a few dominant companies emerge, naturally favoring larger firms. Damodaran believes that "the small cap premium is not coming back," and suggests that selecting investments based on market capitalization will be "at best, a neutral strategy" going forward. |

|
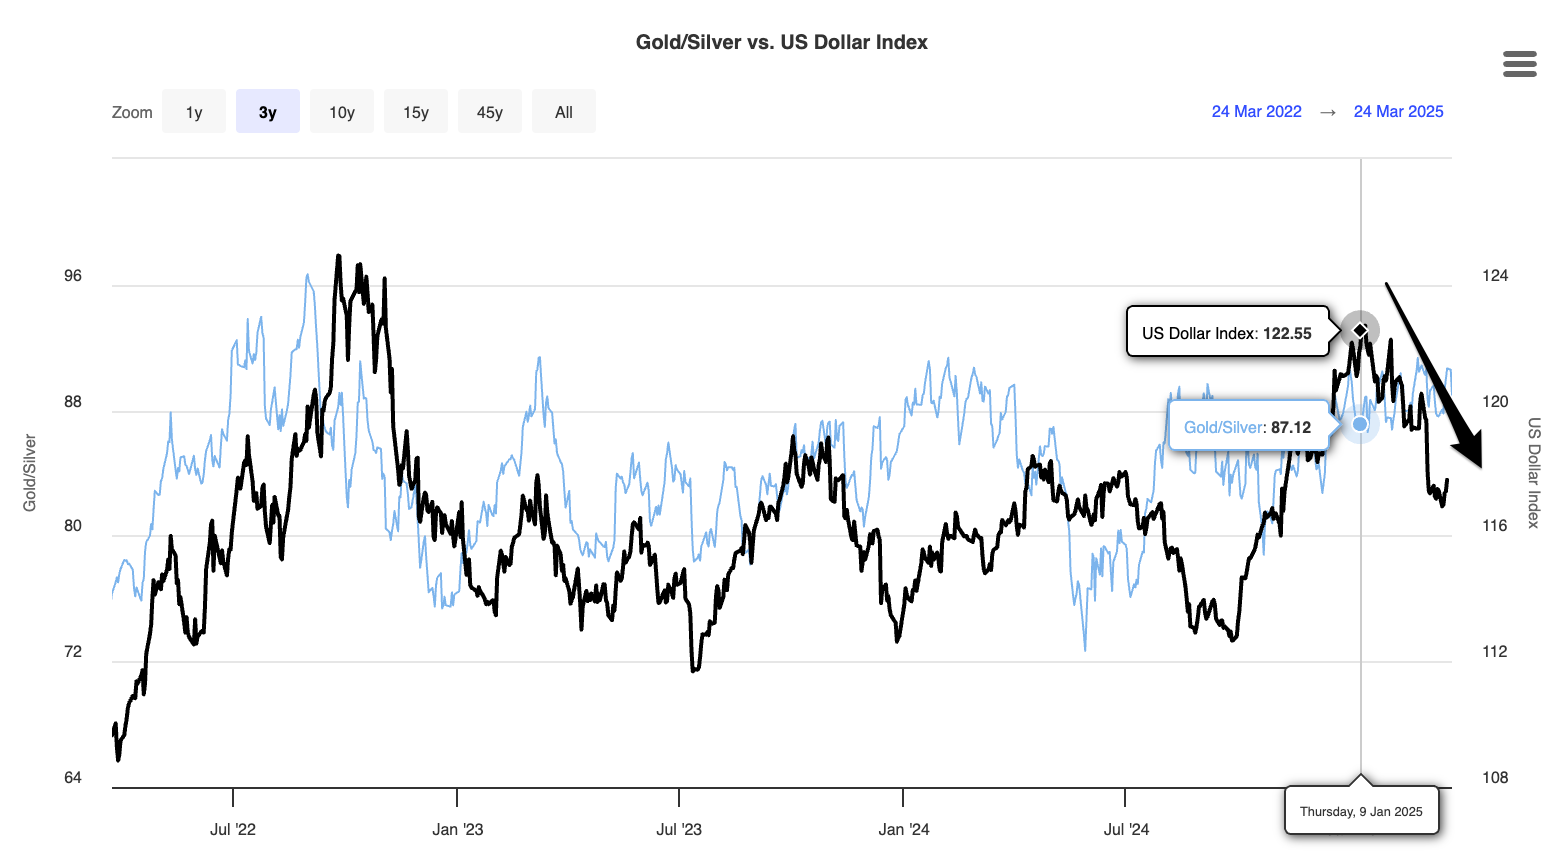
Since November, the U.S. Dollar Index first rose and peaked in January before it reversed. |
|
2. A Mean Reversion in Valuations |
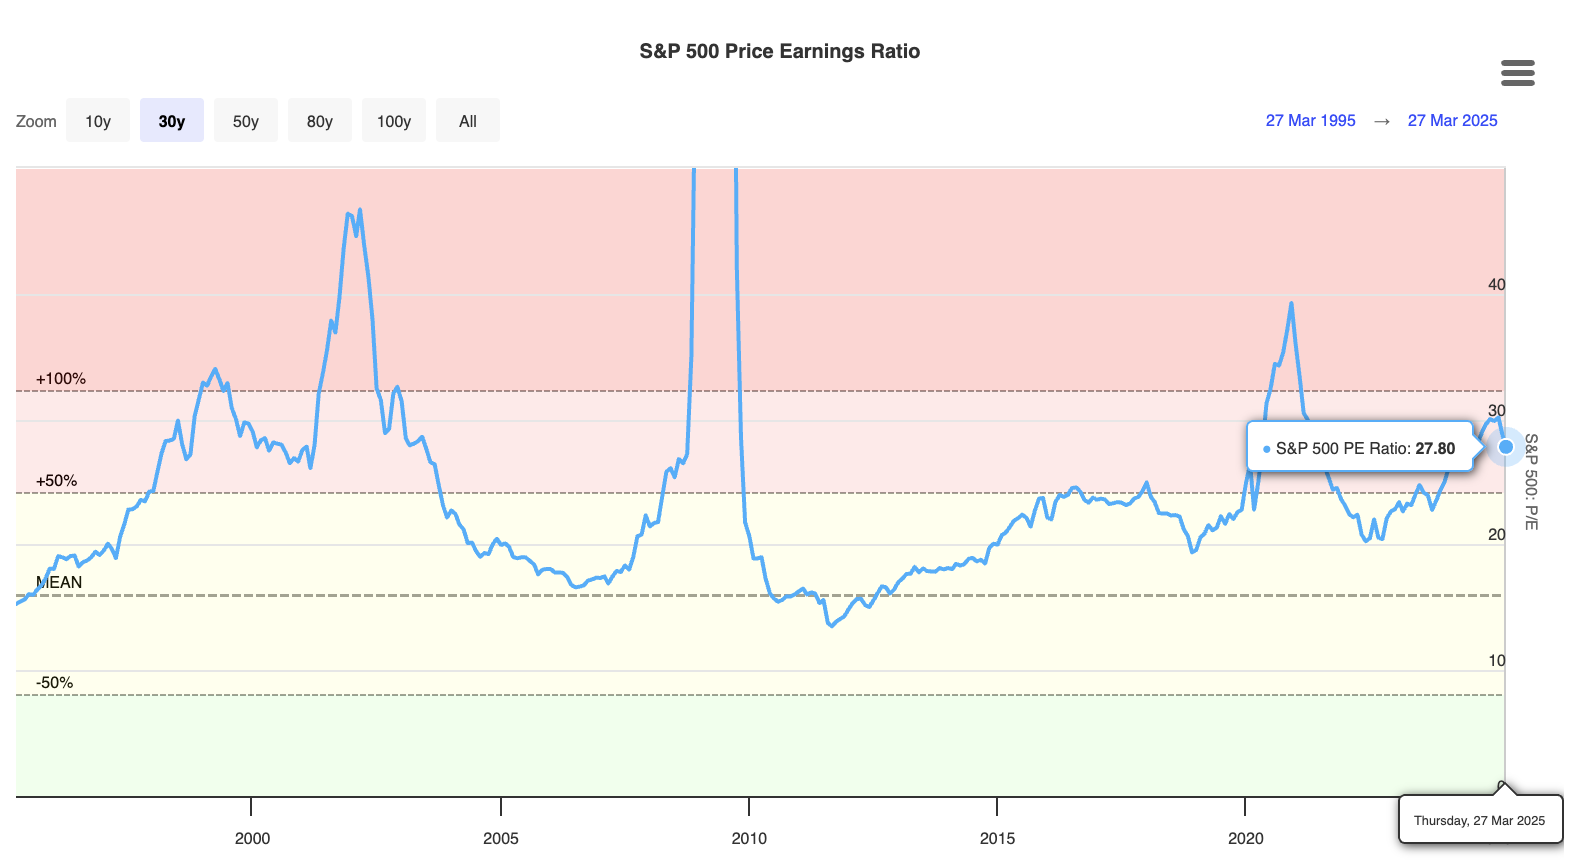
According to Callum Thomas, U.S. assets have enjoyed a "Golden Decade" that began with a generational buying opportunity in 2009, but have now reached "generationally risky" valuation levels. As illustrated in the chart, U.S. assets (stocks, high-yield credit, DXY, housing) have climbed to historically expensive territory, while global assets (emerging markets, developed markets ex-US, frontier markets, and EM bonds) remain comparatively cheap. Thomas suggests investors should "discard biases and have a big rethink" about their asset allocation strategies given this significant valuation gap. |
As of Friday's close, the Magnificent Seven still trade at an aggregate PE ratio of 30.5, ranging from Tesla's 118.9 to Google's 18.8. |
According to Oxbow Advisors, since December, the rise in European Stocks has been driven by an expansion of multiples, rather than a fundamental rise in earnings. |
|
3. Fear Returns to Financial Markets |
Volatility returned to the stock market and peaked on March 9. |
However, Credit Spreads remain tight, with investors still demanding little compensation for holding riskier assets. |
|
4. Crypto Bull Market Disappoints |
|
5. Gold Surges Past $3,000 |
Among all this carnage, Gold kept rising, broke the psychological barrier of $3,000 per ounce, and is up 42.34% over the last year. |
In 2022, when Real Yields started to rise, Gold completely broke the inverse correlation. |
The Real Estate to Gold Ratio nears its lows from 1980 and 2011, with an average single-family home now costing 196.3 ounces of gold. |
|
6. Europe & Defense Stocks Outperform |
Trump’s push for Europe to fund its own security, paired with the EU’s unprecedented €800 billion military modernization plan, has sparked a defense stock rally.
|
|
7. The Real Cost of Tariffs |
Tariffs have significant negative effects on economies, including raising consumer prices, reducing economic growth, and causing job losses. They disrupt global supply chains, reduce efficiency in labor and capital use, and often provoke retaliatory measures from trade partners, further harming export-driven industries. As a recent example, the Tax Foundation found that tariffs imposed during the 2018-2019 trade war resulted in approximately 142,000 job losses. In the aluminum industry alone, tariffs could eliminate 20,000 direct jobs and 80,000 indirect positions.
The tariffs appear to be less about economic revival and more about political leverage. The moderated 10% tariff on China (down from a threatened 60%) and threats against Mexico and Canada to address immigration and border security, such as curbing smuggling tunnels, suggest a negotiation strategy. This aligns with Trump's " Art of the Deal" approach, using tariffs to extract concessions on trade, immigration, or global influence. |

|
This chart by PIIE illustrates that while the Tax Cuts and Jobs Act (TCJA) extensions provide tax cuts across all income levels, the tariffs on Canada, Mexico, and China impose costs that more than offset these cuts for lower and middle-income households. Trump's combined policy changes create a regressive effect, disproportionately benefiting the wealthy while imposing net costs on lower-income Americans. The typical middle-income household would lose over $1,200 annually. |
Import frontrunning has hit record levels as businesses stockpile goods before tariffs. February trade data show industrial supplies imports exceeding forecasts by $12.4 billion. |
This frontrunning in imports has worsened the trade deficit, with February reaching $147.9 billion. |
|
8. Growth Slows as Inflation Persists |
The Federal Reserve reduced the 2025 GDP growth forecast to 1.7% from 2.1% at the March 19 FOMC meeting, with projections for 2026-27 remaining below 2%. |
The Federal Reserve raised its 2025 inflation forecast to 2.7% from the previous 2.5% projection, with expectations of gradual easing to 2.2% in 2026 and reaching the 2% target by 2027. Officials attribute recent inflation pressures partly to tariff impacts, describing these effects as potentially transitory while acknowledging uncertainty about their persistence. |
The Federal Reserve maintained its federal funds rate at 4.25% to 4.5%, adopting a cautious approach amid economic uncertainties, particularly around tariff policies. |
|
9. The Accelerating Debt Spiral |
In its March 2025 Budget Outlook, the CBO predicts federal debt will rise from 100% of GDP in 2025 to 156% by 2055, driven by persistent deficits. Debt will grow from $30 trillion to $138 trillion, with interest rates exceeding economic growth by 2045, sparking a debt spiral. This assumes the 2017 Tax Cuts and Jobs Act (TCJA) expires as scheduled in 2027; extending it without offsets could push debt above 200% of GDP. |
Annual deficits are forecast to increase from 6.2% of GDP in 2025 to 7.3% by 2055, rising from $1.9 trillion to $6.4 trillion, based on current law with the TCJA expiring in 2027. Interest costs will jump from 3.2% to 5.4% of GDP, consuming 28% of revenue by 2055, driven by higher debt and rising rates. |
Spending is projected to climb from 23.3% of GDP in 2025 to 26.6% by 2055, while revenue rises from 17.1% to 19.3%, assuming the TCJA expires in 2027. The deficit is fueled by mandatory expenditures on health care (5.8% to 8.1%), Social Security (5.2% to 6.1%), and interest (3.2% to 5.4%), which cannot be cut by DOGE. |
Ray Dalio presented a “3% Solution” which seeks to avert a U.S. debt crisis by cutting the federal deficit from 7.5% of GDP ($2 trillion) to 3% ($900 billion). He urges immediate bipartisan action within the first 100 days of a new administration, targeting the 30% discretionary spending to avoid the 70% in mandatory programs like Social Security and Medicare. This would stabilize the 125% debt-to-GDP ratio by keeping deficits below historical GDP growth (over 3%), reducing the $1 trillion interest burden as market confidence lowers rates. Dalio warns that delays worsen the spiral of rising interest and borrowing, risking fiscal collapse amid domestic and global tensions. |
|
10. The Widening Wealth Gap |
According to the Tax Policy Center, the 2017 Trump tax law actively worsened income inequality through its regressive structure. While the bottom 60% of Americans received a negligible benefit of just 1% of their pre-tax income, the wealthiest households enjoyed tax cuts more than three times larger—averaging 3.2% of their income. This upside-down approach to tax policy deepened existing disparities at a time when income inequality was already at historic highs.
In fact, by 2018, the tax system had become so regressive that the richest 400 families in the U.S. paid an average effective tax rate of 23% while the bottom half of American households paid a rate of 24.2%. |

|
Ray Dalio's chart illustrates America's growing wealth inequality through two key trends. The left graph shows labor's share of private earnings declining steadily from its 1970s peak, meaning workers receive a diminishing portion of economic output compared to capital owners. The right graph tracks income distribution between population segments over time, with the bottom 60% of Americans seeing their share shrink while the top 40% captures an increasing portion. Together, these patterns demonstrate how income is increasingly determined by existing wealth rather than work, creating a self-reinforcing cycle where those who already possess capital continue to gain economic advantage over those who rely primarily on wages. |
Inequality has been rising throughout the developed world. Among OECD-28 countries, on average, households in the top 10% of the wealth distribution own more than half (52%) of all total household wealth, and this share is as high as 79% in the United States. |
Evidence of consumer distress can be seen in many places, for example, in rising delinquencies in car payments. |
|
11. Housing Remains Unaffordable |
Housing remains unaffordable for most, with Home Prices rising faster than income over the past 5 years. |
|
12. China's Economic Rise |
In his speech at the American Dynamism Summit, U.S. Vice President JD Vance critiqued globalization, arguing that it rested on the flawed assumption that rich nations like the U.S. could focus on designing high-value products (e.g., iPhones in California) while outsourcing manufacturing to poorer countries, maintaining a monopoly on innovation. The goal, he explained, was to keep Western economies atop the global value chain, profiting from intellectual property and cheap overseas labor, while limiting developing nations in low-end production. However, Vance admitted they learned this backfired: manufacturing hubs like China mastered design too, leveraging "network effects" to climb the value chain, outpacing the U.S. in industries like shipbuilding—where America now builds just five ships yearly versus thousands in WWII—revealing that globalization eroded U.S. industrial dominance rather than securing it.
According to Aswath Damodaran, China emerged as the biggest winner of globalization, experiencing a dramatic surge in economic and political power over the last four decades, with its share of global GDP rising tenfold. This rise came significantly at the expense of Japan and Europe, which saw their economic influence wane. |

|
These charts show China's dramatic rise in global manufacturing from 1995-2020. The left panel displays China's manufacturing share surging from 5% to 35%, overtaking the U.S. (which fell from 23% to 12%), Japan, and other G7 nations. The right panel illustrates how China's manufacturing output now equals the combined share of the next ten largest manufacturing countries, reversing the situation from 1995. This unprecedented industrial transformation occurred in just 15-20 years, with China surpassing Germany (1998), Japan (2005), and the U.S. (2008). |

|
China developed a strategic foreign investment action plan to offset tariff impacts by attracting international capital and building diverse trade partnerships beyond the US, ensuring economic resilience amid trade tensions. However, beneath China's manufacturing dominance lurks a precarious financial reality. These charts reveal alarming debt accumulation—government debt surging from negligible levels to 70% of GDP, while private debt exceeds 200%. This trajectory mirrors debt spirals preceding economic crises elsewhere. |

|
In this excerpt from his "How Countries Go Broke" series, Ray Dalio examines the parallel challenges facing China and the United States. Both superpowers are confronting the same five major forces: significant debt issues, increased internal conflicts leading to stricter control policies (autocratic in China, semi-autocratic in the US), rising international tensions with each other, potential climate change impacts, and a technology competition neither can afford to lose. Dalio observes that today's US-China standoff resembles the world's stage in the mid to late 1930s, with allies aligning behind both powers and their ideologies. He describes this as "shaping up to be the greatest great powers conflict ever" that fortunately hasn't yet turned militaristic. Through his many years of experience and contacts in China, Dalio learned how differently the sides approach conflict—Western countries follow a "Mediterranean approach" which is head-on, while China employs the more subtle, deceptive strategies described in Sun Tzu's "Art of War" written 2,500 years ago. These timeless principles, Dalio notes, influence how Chinese leaders approach dealing with their people and the outside world. |
|
We are building a Community! |
We're thrilled to announce the launch of the Longtermtrends Community! After years of providing data-driven insights through our charts and analyses, we're creating a space where investing enthusiasts can connect, share experiences, and learn together. Our community is growing fast with over 200 accounts created in just two weeks, joining our base of 15,000+ newsletter subscribers. Whether you're a seasoned investor or just beginning your financial journey, there's a place for you in our community. Visit our website to create your free account today and join our Discord server to start connecting with fellow trend-watchers! |
|
And that wraps up our Quarterly Chart Brief! Here's to a productive quarter ahead. Stay tuned and take care until our next roundup! Did you enjoy this Quarterly Chart Brief? Please consider donating, as Longtermtrends is a non-profit operation. Every donation will be reinvested in the site! Are you interested in becoming a sponsor and reaching a targeted audience that includes many investors and finance professionals? Click here to learn more. Thanks for reading and have a nice day! |
|
Disclaimer: All information provided is for educational purposes only and does not constitute investment, legal or tax advice, or an offer to buy or sell any security. Read our full Terms of use here. |
|
|
|
You received this email because you subscribed to our list. You can unsubscribe at any time. Terms of useLongtermtrends, Albulastrasse 34, Zürich, ZH, 8048, Switzerland |
|
|
|